G8 reported its interim 1H15 results to 30 June
Compared to the corresponding half, revenue increased to $310.8m ($187.3m 1H14), EBITDA was $63.4m ($32.3m 1H14) and NPAT was $28.2m ($16.3m 1H14). Growth was primarily driven by acquisitions with the group adding 21 new centres during the half with another 17 contracted but not yet settled at year end.
Financial summary
| 1H15 | 1H14 |
| Total revenue | 310.8 | 187.3 |
| EBITDA | 63.4 | 32.3 |
| NPAT | 28.2 | 16.3 |
| Interest expense | 20.5 | 6.6 |
| Net debt | 252.4 | 108.3 |
Source: FIIG Securities, G8 Education
Financial performance

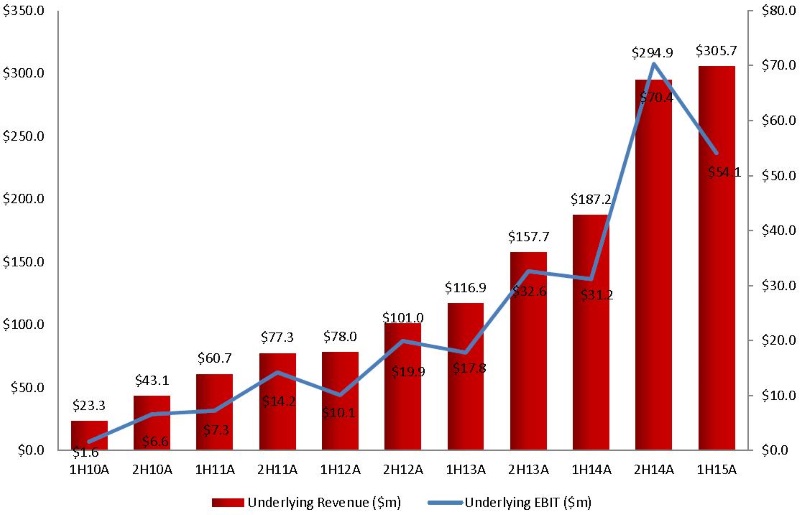
The graph depicts the financial performance of G8 for the period including underlying: revenue and EBIT.
Source: FIIG Securities, G8 Education
Underlying revenue and EBIT continue to grow. However, figures are affected by seasonal fluctuations in occupancy from January to June compared with July to December due to the transition of children from Kindergarten to Primary School in January each year.
The group’s efficiency and economies of scale are demonstrated by the like for like growth of the 229 centres owned during 1H14 and 1H15. G8 was able to grow revenue for these centres by 5.6% and manage expenses so that EBIT grew 17% to $35.7m.
It is likely that G8 will use an increasing proportion of debt to fund acquisitions and growth, as mentioned in an earlier note. If debt levels increase without sufficient growth in earnings, this will weaken the credit profile of G8. The company may also pay higher acquisition multiples than what they have historically. The current bid for listed rival Affinity Education is a good example of such risks. Please see last week’s note for more information on the Affinity proposal.
At current levels of around 335bps over for the 2018 and 390bps over for the 2019 the G8 bonds look fair value noting the credit profile will likely continue to weaken but remain manageable.